Axonometric Diagram
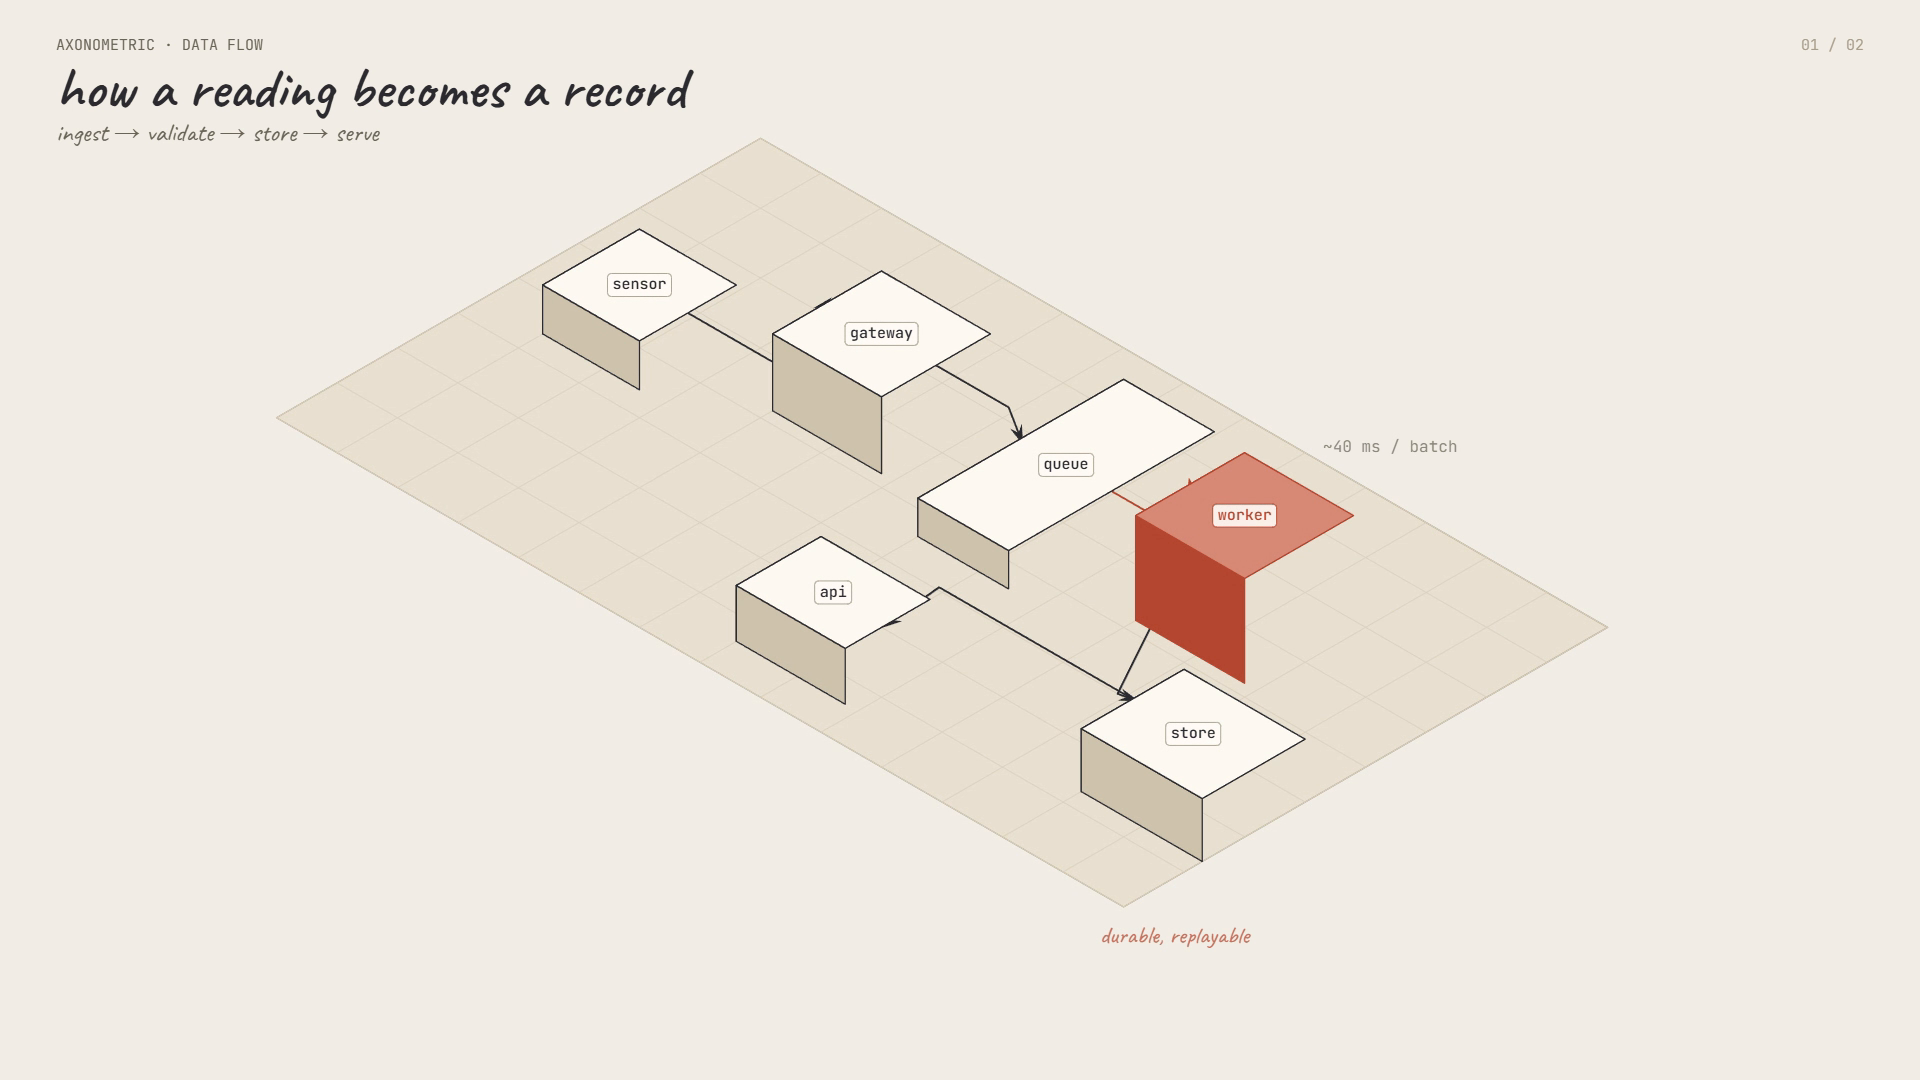
A deterministic, hand-drawn axonometric diagram that builds itself. Graph nodes drop in as extruded boxes on a parallel-projected ground grid — each face shaded from one light — then orthogonal connectors grow in work order with arrowheads, labels land on the top faces, and the camera pans the flow. Architecture, data flow, dependency and deploy topology in one readable shot.
How it works
Author one JSON sheet: nodes, links with edge anchors, notes and camera keys
build.mjs validates the sheet and inlines the canvas engine + fonts into one page
render.mjs captures the page headlessly and writes a silent MP4 plus a report