City Through Time
How a living city grew, era by era: its walls and extent light up across today's real streets and buildings, with English narration, subtitles and landmark illustrations.
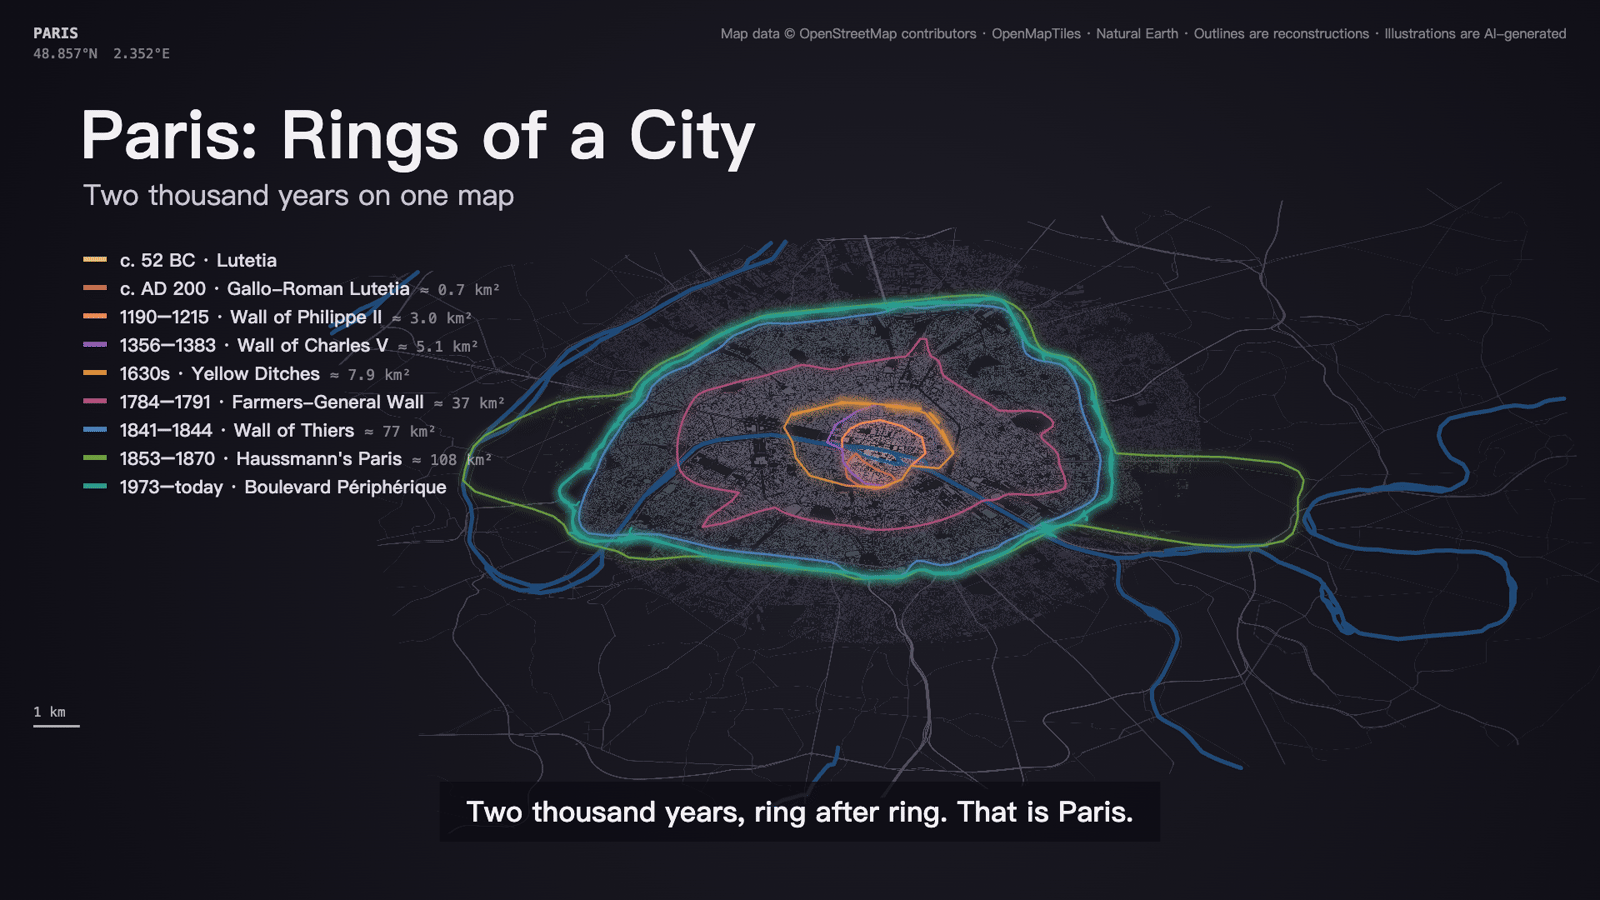
A narrated map film of how a living city grew and changed. A turning globe lands on the city, then a dark tilted map of today's real streets and buildings lights up era by era: each era's walls draw in while the streets and buildings inside them glow in its colour, landmark illustrations float up, and an English narrator tells each step with matching subtitles. It ends with every era's outline stacked as the city's rings.
How it works
Resolve: real outlines from OpenStreetMap and a basemap of streets, buildings and rivers
Media: narration (MiniMax Speech 2.8 HD) and illustrations (Qwen Image 3) through SandBase, after a cost estimate
Look at stills, then render the 1080p film with the narration laid in
Frequently asked questions
Which cities work?
Living cities that still exist, best with a dense historic centre mapped in OpenStreetMap: Rome, Paris, Istanbul, Beijing, London, Kyoto and the like. The map is today's city; a vanished city with no living successor is out of scope.
How accurate is it?
Outlines come from OpenStreetMap where the walls, or the boulevards built on their line, are mapped; elsewhere from the Agent's fallback outline. They are reconstructions, and the film says so. The language model gets facts and coordinates wrong, so review every narration line and the stills before paying for media.
What does it cost?
Maps and rendering need no model calls. Narration and illustrations run through SandBase and are billed per clip and per image; media.mjs prints the estimate and spends nothing until you add --confirm. Writing story.json with MiniMax M3.1 flash is a small text cost.