Harvest Map: Valley Harvest
Zoom across a valley of crop fields where markers spring apart, the legend counts what is in view and search ranks where each crop grows.
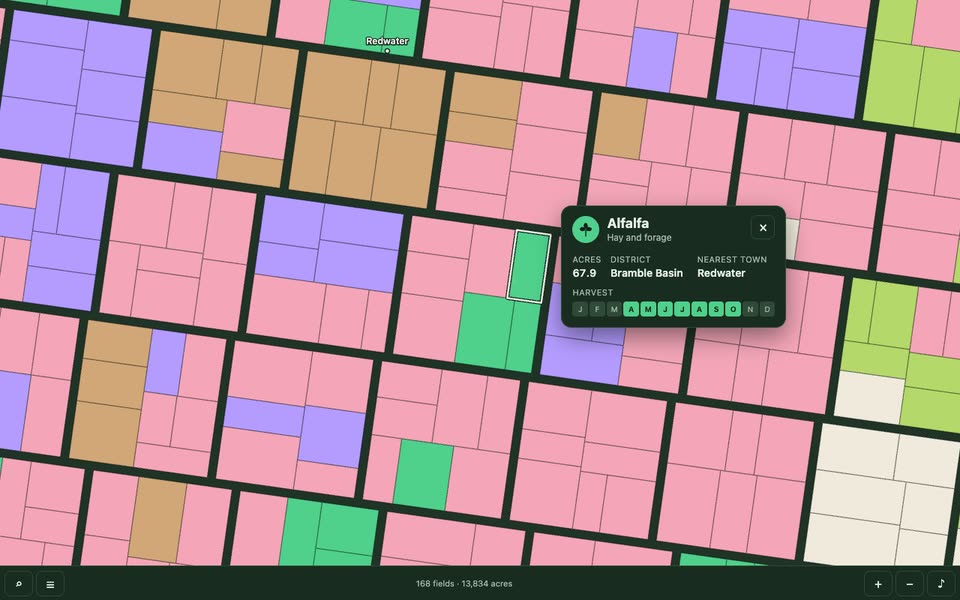
Bring a region, its crops with colours and harvest months, place names and an optional palette. The Skill returns a downloadable Skill, an interactive demo and an example video.
How it works
Generate a project and edit the outline, river, crops, districts, towns and palette in valley.json.
Build the offline HTML and run the map logic tests and bilingual interaction checks.
Download the Skill and explore its interactive demo and example video.
Frequently asked questions
Does it need a model key?
No. The scene runs offline and does not call a model.
Is the data real?
No. The valley, its fields, crops and towns are invented. The method notes explain how to load your own field polygons and what to check about their licence.
Does it need map tiles?
No. Everything is drawn on a Canvas 2D map from the project data; there are no tile or basemap requests.
Is it accessible?
It is designed toward WCAG 2.2 AA: a focusable map with keyboard pan, zoom and field focus, visible focus, a legend of labelled buttons, a card dialog and a live text summary. Full conformance needs testing with assistive technologies and expert review.