Pencil Chart Annotate
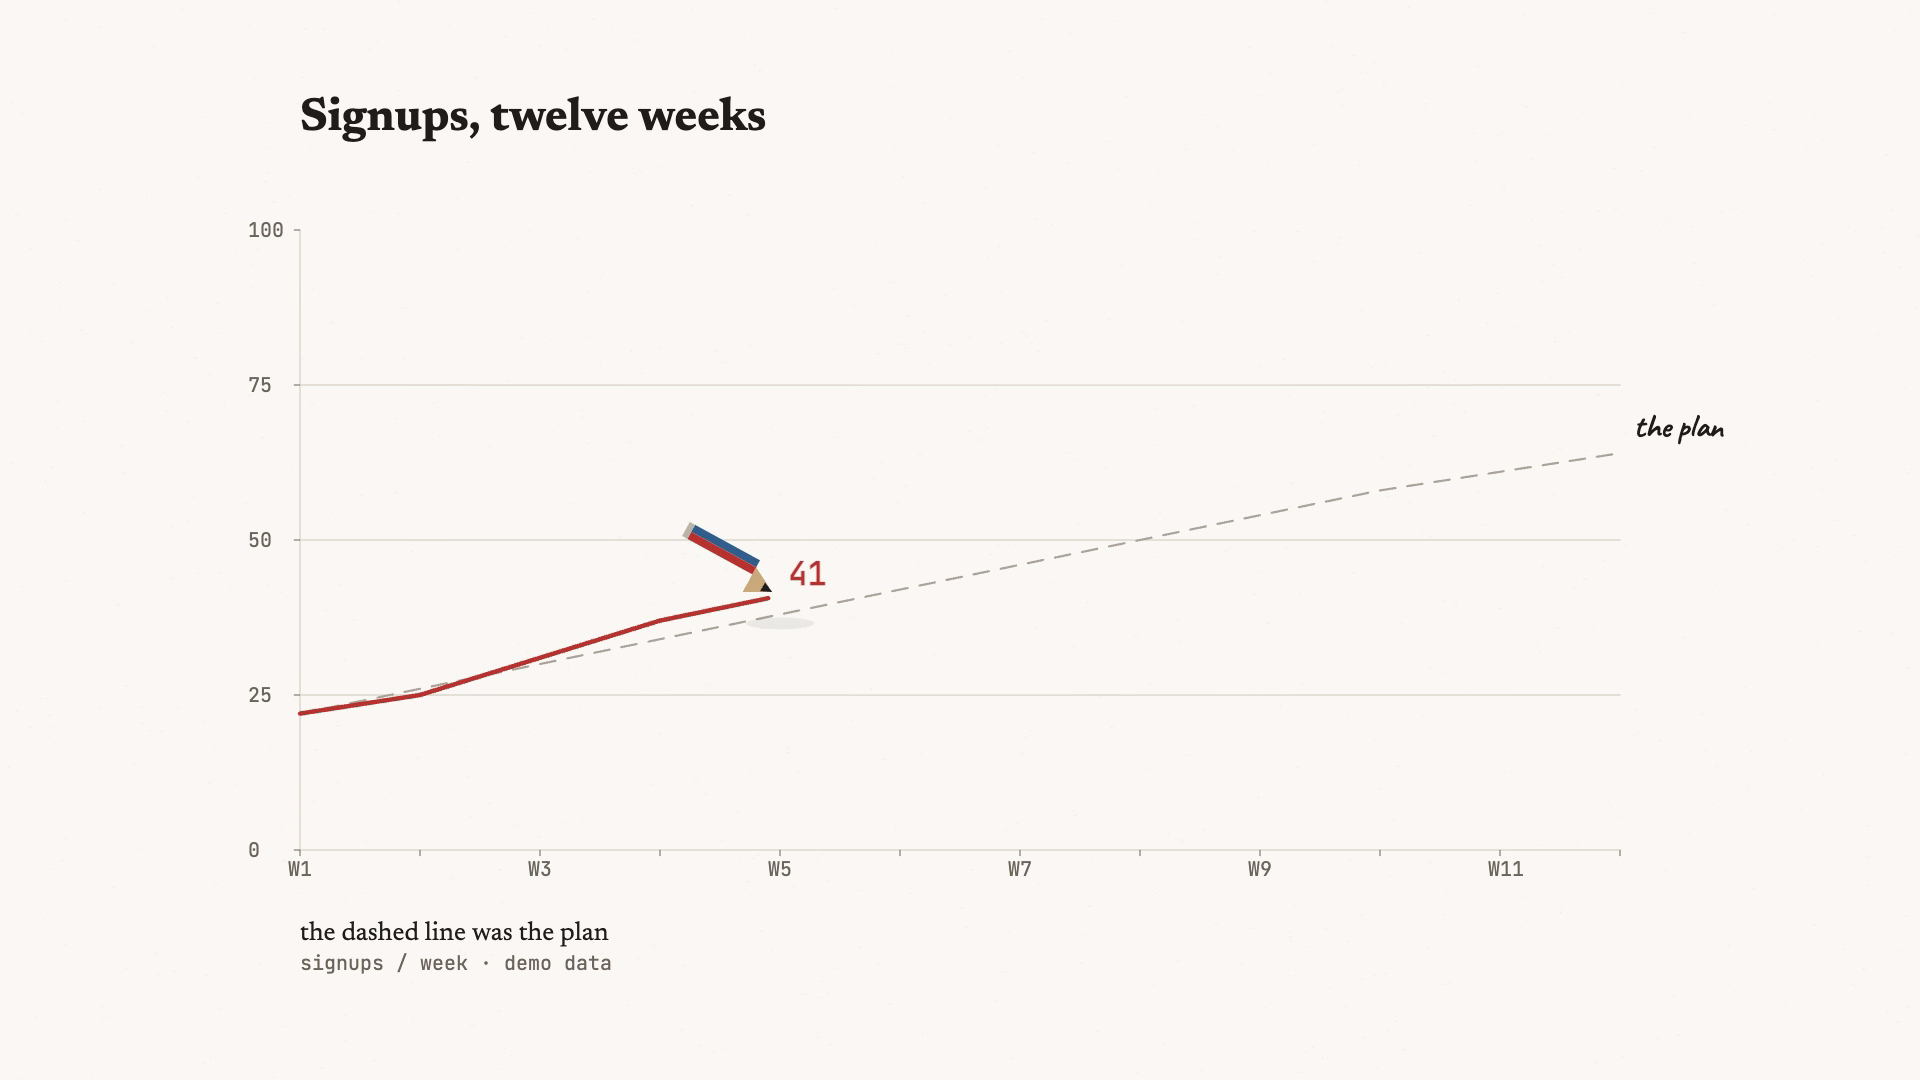
A silent editorial data-story film on cream paper: the chart first draws the guess — a grey dashed expected curve, held on screen — then lets the real line draw through it in signal colour at a linear rate, while handwritten notes pin themselves to the data points the line passes. A red-blue pencil leads the stroke, and the axis can re-range in two beats, carrying its annotations with it.
How it works
Author scenes + ops in sheet.json
build.mjs validates and assembles the HyperFrames page
render.mjs produces a silent mp4 + report.json