Seminar Math Slides
Turn a paper, thesis chapter or research notes into a projection-ready 16:9 talk for seminars, colloquia, defences and conference sessions: a section strip with the current section lit, equations with spoken readings and term glosses, a method pipeline, a proof sketch, native result bars and tables, plots drawn from data and a progress bar with frame counters.
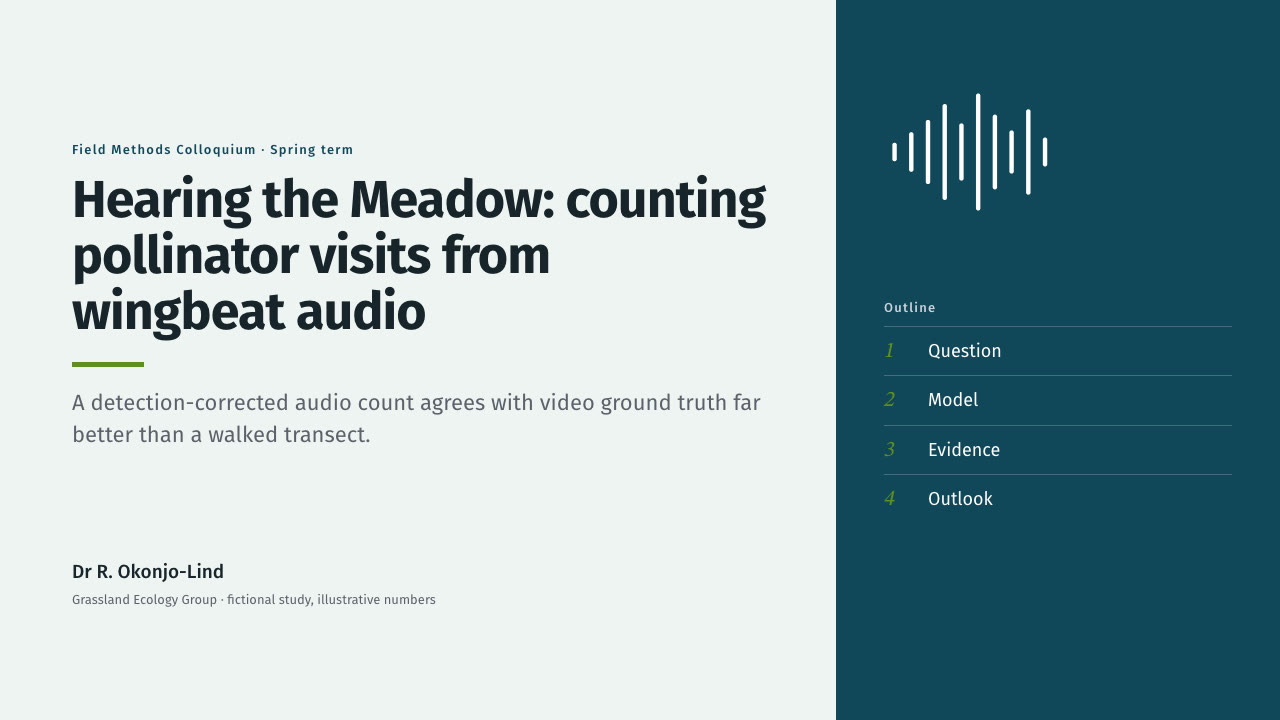
Bring the paper or notes, the talk length and audience, the equations, numbers and data to use exactly. The Skill returns one offline HTML deck that edits in the browser and exports editable PowerPoint.
How it works
Brief and sequence
Your Agent asks for the topic, the audience, what should happen after the talk, the facts and numbers to use exactly and the page count, then gives every page one layout and picks one palette.
Pictures and build
It turns figure specs into SVG plots with talk.py plot, then talk.py pace fills the section strip, footer and counters and prints a minutes-per-frame budget with split or merge advice. It writes plan.json and settings.json, then runs kit.py compose, make-deck.py and verify-deck.py to build one offline HTML file.
Look and export
It opens every page in a browser and checks wraps, overlaps and labels, tries edit, undo, save and present, then exports PowerPoint and runs verify-pptx.py against the deck.
Frequently asked questions
Is the PowerPoint really editable?
Yes. Titles, equations, glosses, labels, bars, table cells and panels are native PowerPoint objects with speaker notes, and each table is a native table. Pictures are only the drawn plots and the title emblem; no slide is a full-page image. The example decks have 144 and 106 text boxes.
Where do the plots come from?
From your data. The bundled talk.py plot draws line, scatter and band plots as SVG with the Python standard library; it calls no model or image service. All people, groups and figures in the examples are fictional and every data page says so.
Which fonts does it use?
Fira Sans for text and STIX Two Text for mathematics, both bundled under the SIL Open Font License. Install both on the presenting machine for matching line breaks; PowerPoint shows the medium title weight as regular. Chinese, Japanese and Korean use system faces.
What are the known limits?
Equations are not a math engine. Tick labels inside a plot are part of the picture. In LibreOffice a small superscript symbol such as ∗ renders very small. Section openers leave the lower half of the frame open by design.
What was tested?
Both example decks were built from a fresh unzip of the package. Every page was inspected in Chrome and in a LibreOffice render of the exported PowerPoint, 31 browser interaction checks passed on each deck, and python-pptx edits survived save and reopen. PowerPoint, Keynote and WPS were not opened.